Analytics
What Is It?
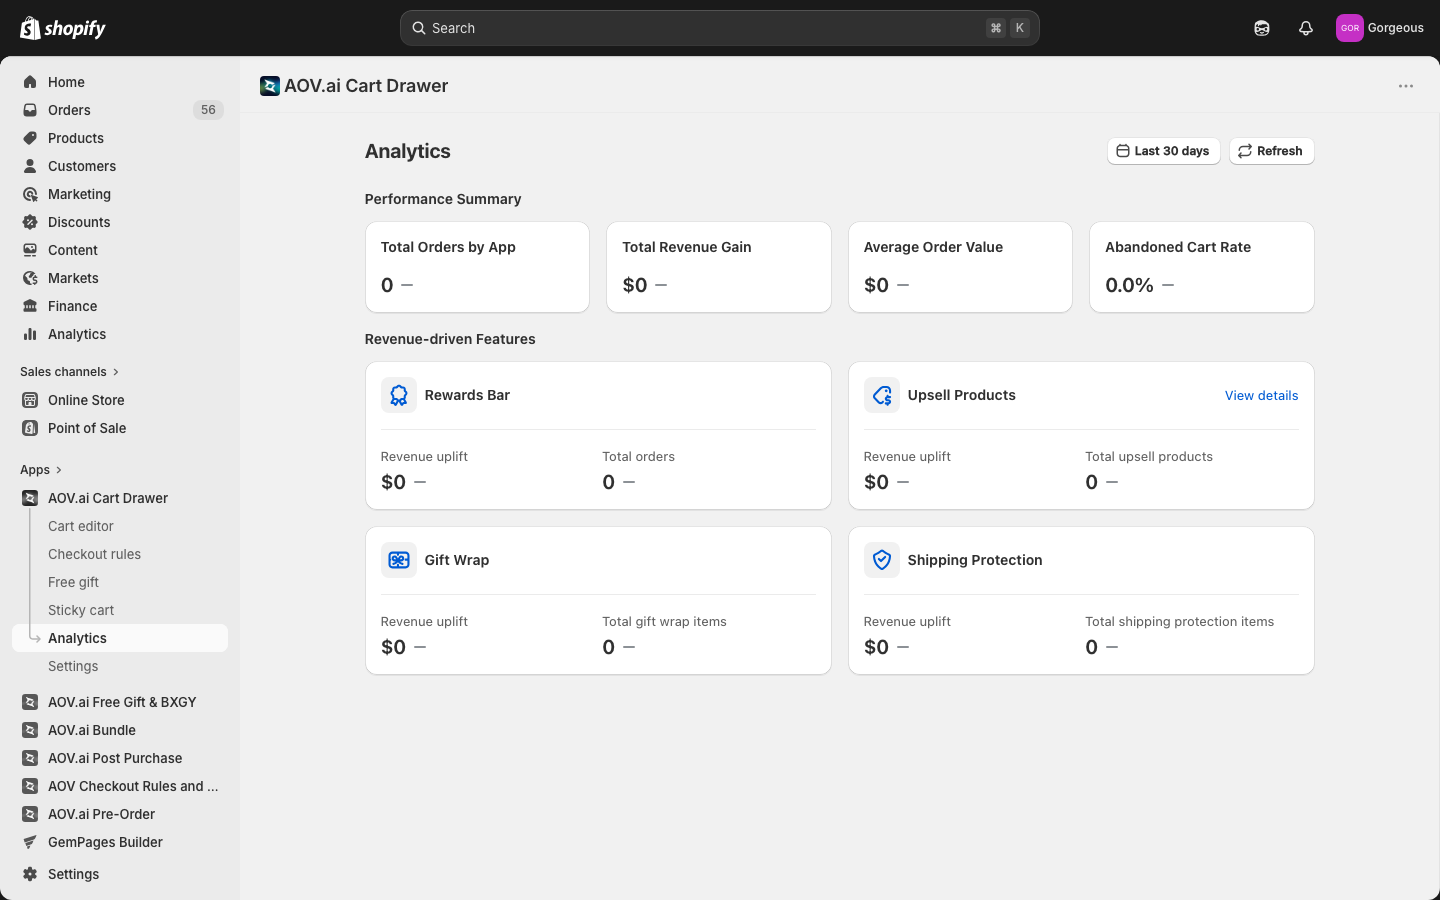
Analytics is the reporting page where you track how the cart drawer is performing. It shows headline order and revenue numbers, breaks down how much each revenue-driving feature contributes, and lets you drill into per-product results. It is a read-only dashboard, so there is nothing to save here. You simply read the numbers and adjust your cart drawer settings elsewhere based on what you see.
You open it from the Analytics item in the left navigation, which loads the Analytics page.
When to Use It
- You want to see how many orders and how much revenue the app is driving over a chosen date range
- You want to know which features (Rewards Bar, Upsell Products, Gift Wrap, Shipping Protection) are pulling their weight
- You want to find your best-performing upsell products before deciding what to feature
How to Read Your Analytics
Step 1: Open the Analytics Page
From the left navigation, click Analytics.
Step 2: Set the Date Range
Use the date picker in the top right to choose the period you want to measure. Every number on the page updates to match the range you pick.
Step 3: Refresh the Data
Click Refresh next to the date picker to pull the latest numbers without reloading the page.
Performance Summary
The Performance Summary section is a row of four cards giving you the top-level view of how the app affects orders and revenue. Each card also shows the change versus the previous period.
| Metric | What it tells you |
|---|---|
| Total Orders by App | The number of orders the app contributed to in the selected range. |
| Total Revenue Gain | The extra revenue attributed to the app, shown in your store currency. |
| Average Order Value | The average value of those orders, shown in your store currency. |
| Abandoned Cart Rate | The share of carts that did not convert, shown as a percentage. For this metric a lower number is the good direction. |
Revenue-driven Features
The Revenue-driven Features section breaks down how much each cart drawer feature contributes. There is one card per feature, and each card shows a Revenue uplift figure plus a feature-specific count.
| Feature | First stat | Second stat |
|---|---|---|
| Rewards Bar | Revenue uplift | Total orders |
| Upsell Products | Revenue uplift | Total upsell products |
| Gift Wrap | Revenue uplift | Total gift wrap items |
| Shipping Protection | Revenue uplift | Total shipping protection items |
How Revenue Uplift Is Counted
Each feature uses a different counting method:
Upsell Products
- Revenue uplift: total of
price × quantityfor every upsell line item added through the Upsell Products feature in the cart drawer, across all attributed orders in the selected date range. - Total upsell products: number of distinct products added as upsell items.
Gift Wrap
- Revenue uplift: total of
price × quantityfor every Gift Wrap line item added through the cart drawer. - Total gift wrap items: number of gift wrap add-ons sold.
Shipping Protection
- Revenue uplift: total of
price × quantityfor every Shipping Protection line item added through the cart drawer. - Total shipping protection items: number of shipping protection add-ons sold.
Rewards Bar
- Revenue uplift: sum of the full order total for every order where the rewards bar threshold was reached. For example, if the rewards bar offers free shipping at $50 and a customer hits $50 and checks out, their entire order value counts toward Rewards Bar revenue uplift — not just the items that pushed them over the threshold.
- Total orders: number of orders where the rewards bar threshold was reached.
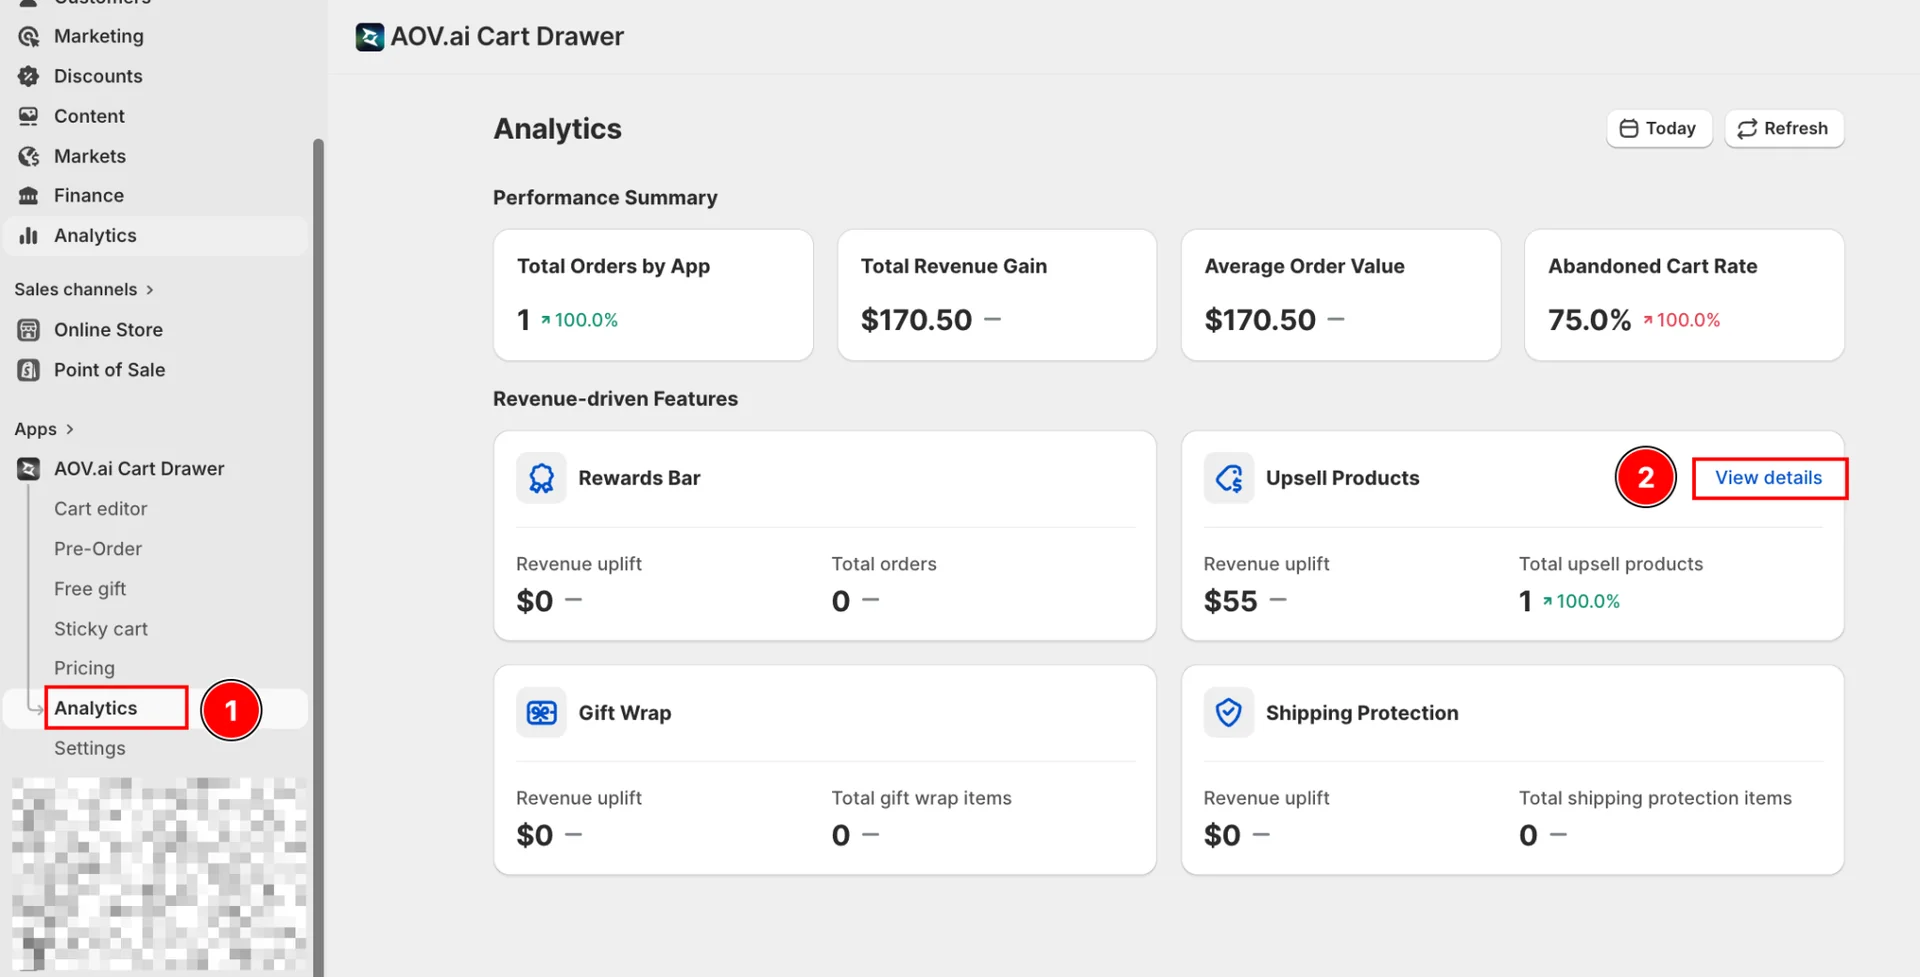
The Upsell Products card links through to a detailed Product performance view. Open it to see how individual products are doing.
Product Performance
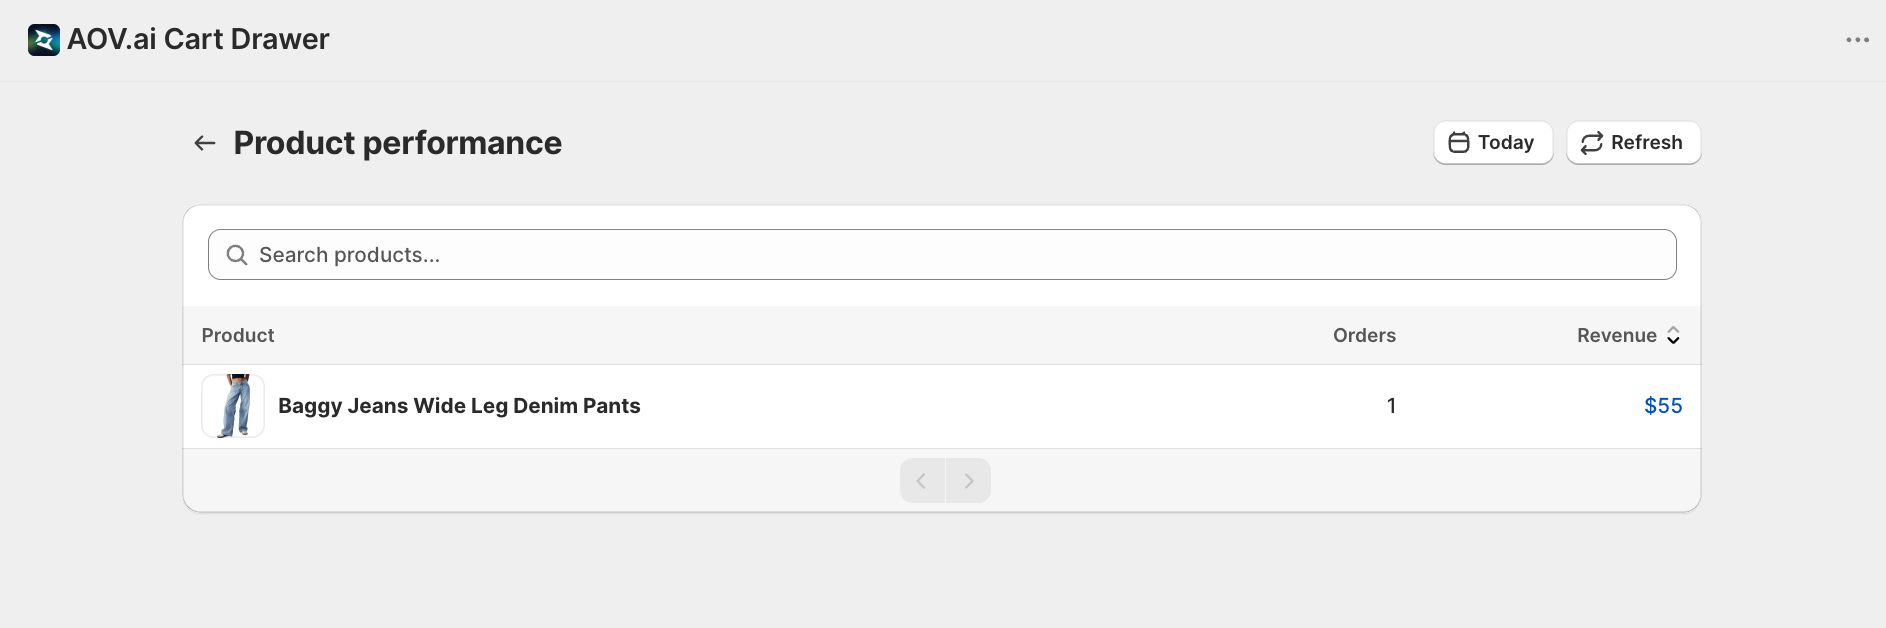
The Product performance page lists your products in a table so you can see which ones drive the most orders and revenue. Reach it from the Upsell Products card in Revenue-driven Features: click Analytics ① in the left sidebar, then click View details ② on the Upsell Products card.
Search for a Product
Use the search box at the top to filter the list. The placeholder reads Search products.... Clear the box to see the full list again.
Read the Columns
The table has three columns:
- Product: the product name and thumbnail
- Orders: how many orders included this product
- Revenue: the revenue from this product, in your store currency
You can sort by Orders or Revenue by clicking the column heading. The list defaults to sorting by Revenue, highest first.
The same date picker and Refresh button from the main Analytics page are available here. Use the back action in the page header to return to Analytics.
Troubleshooting
Q1: All my numbers show zero
The most common cause is a date range with no activity. Widen the range using the date picker, then click Refresh. New stores also need some order history before figures appear.
Q2: A feature card shows no revenue uplift
That feature has not generated attributed revenue in the selected range. Confirm the feature is enabled in your cart drawer settings, then check a longer date range.
Q3: Product performance shows "No items found"
The selected date range or search term returned nothing. Clear the Search products... box and widen the date range. If the store is new, allow time for orders to accumulate.
Q4: The numbers look out of date
The page does not refresh on its own. Click Refresh to pull the latest data for the current date range.